dendrogram
Dendrogram plot
Syntax
Description
dendrogram( generates a dendrogram plot of the
hierarchical binary cluster tree. A dendrogram consists of many
U-shaped lines that connect data points in a hierarchical
tree. The height of each U represents the distance between
the two data points being connected.tree)
If there are 30 or fewer data points in the original data set, then each leaf in the dendrogram corresponds to one data point.
If there are more than 30 data points, then
dendrogramcollapses lower branches so that there are 30 leaf nodes. As a result, some leaves in the plot correspond to more than one data point.
dendrogram(___,
specifies additional options using one or more name-value arguments. For
examples, you can specify the order of leaf nodes and the orientation of the
dendrogram plot.Name=Value)
dendrogram(
displays the plot in the target axes. Specify ax,___)ax as the
first input argument followed by any of the input argument combinations in the
previous syntaxes.
H = dendrogram(___)Line objects. You can use any of the argument
combinations from the previous syntaxes.
[ also returns a vector H,T,outperm]
= dendrogram(___)T containing the
leaf node number for each object in the original data set, and a vector
outperm giving the order of the node labels of the
leaves as shown in the dendrogram.
It is useful to return
Twhen the number of leaf nodes,P, is less than the total number of data points, where some leaf nodes in the display correspond to multiple data points.The order of the node labels given in
outpermis from left to right for a vertical dendrogram, and from bottom to top for a horizontal dendrogram.
Examples
Generate sample data and use it to create a hierarchical binary cluster tree using the linkage function. Plot a dendrogram of the tree.
rng(0,"twister") % For reproducibility
X = rand(10,3);
tree = linkage(X,"average");
dendrogram(tree)

Generate sample data and use it to create a hierarchical binary cluster tree using the linkage function.
rng(0,"twister") % For reproducibility
X = rand(10,3);
tree = linkage(X,"average");
Calculate an optimal leaf order and plot a dendrogram.
D = pdist(X);
leafOrder = optimalleaforder(tree,D)
leafOrder = 1×10

     3     7     6     1     4     9     5     8    10     2
dendrogram(tree,Reorder=leafOrder)

The order of the leaf nodes in the dendrogram plot corresponds to the permutation in leafOrder.
Generate sample data.
rng(0,"twister") % For reproducibility
X = rand(100,2);
There are 100 data points in the original data set, X.
Create a hierarchical binary cluster tree using the linkage function. Then, plot the dendrogram for the complete tree (100 leaf nodes) by setting the input argument P equal to 0.
tree = linkage(X,"average");
dendrogram(tree,0)
Now, plot the dendrogram with only 25 leaf nodes. Return the mapping of the original data points to the leaf nodes shown in the plot.
figure
[~,T] = dendrogram(tree,25);

List the original data points that are in leaf node 7 of the dendrogram plot.
find(T==7)
ans = 7×1

     7
    33
    60
    70
    74
    76
    86
Generate sample data and use it to create a hierarchical binary cluster tree using the linkage function.
rng(0,"twister") % For reproducibility
X = rand(10,3);
tree = linkage(X,"average");
Plot the dendrogram with a horizontal orientation, using the default color threshold. Return the Line objects so you can change the dendrogram line widths.
H = dendrogram(tree,Orientation="left",ColorThreshold="default");
set(H,LineWidth=2)

Since R2024b
Generate sample data and use it to create a hierarchical binary cluster tree using the linkage function.
rng(0,"twister") % For reproducibility
X = rand(25,3);
tree = linkage(X,"average");
Assign the leaf nodes to clusters.
clusterAssignments = cluster(tree,Cutoff=1.1,Criterion="inconsistent");Plot the dendrogram. Color the groups of nodes and leaf node markers according to their cluster assignments. Show a dashed line indicating where the tree is cut to produce the cluster assignments.
dendrogram(tree,ClusterIndices=clusterAssignments, ...
    ShowMarkers=true,ShowCut=true);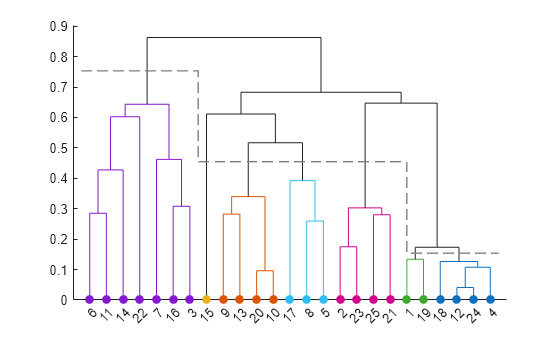
Input Arguments
Name-Value Arguments
Output Arguments
Version History
Introduced before R2006aSee Also
cluster | clusterdata | cophenet | inconsistent | linkage | optimalleaforder | pdist | silhouette