50 results

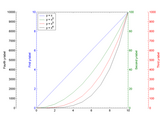
PLOTYYY - Extends plotyy to include a third y-axis
PLOTYYY builds upon plotyy to include a third y-axis. It also provides an easy way of labelling all three y-axes at once.

A plot/plotyy alternative (data exploration optimized).
This toobox, containing the plt plotting routine (an alternative to Matlab's plot & plotyy) has been obsoleted. If you have been using plt in your work, don't worry since it is still still

Record your own speech file to use for other exercises.

The Waveform Suite is now developed as part of the geoscience community codes, linked below.

The toolbox converts 2D & 3D MATLAB plots to the METAPOST or Multi-METAPOST format.

The is an implementation of the randomized response model for privacy preserving smart metering

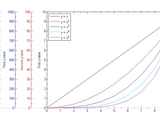
MULTIPLOTYYY allows the user to plot multiple lines on three sets of y-axes.
PLOTY4 support for a third and fourth y-axis.

Plots graphs with arbitrary number of Y-axes. Generalization of plotyy.
plotyn Extends plot to create a separate Y-axis for each dataset. It is a generalization of Matlab's inbuilt function PLOTYY.Creation mode, needs to be run first:Syntax: [hax, hlines, data] =

A plot function much more powerful than plotyy
When we use matlab function plotyy, it's inconvenient to setup the labels and ranges of the three axes and the legend of the two lines. What's more, plotyy can not be used in some cases, for

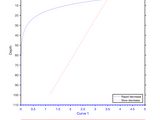
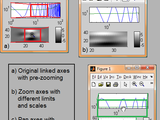
Simplify zooming of plotyy dual plots.
The command plotyy is handy, but the implementation (superposing two plots on top of each other) present some problems. One of them is zooming, which does apply to only the uppermost plot (see

Zooming and panning with the mouse in 2D plots. Supports plotyy, loglog, subplot, etc.
in all open figures. The axes will not be linked except for axes belonging to the same plotyy-plot or yyaxis-axes ii) 'all_linked': activates mouse control for all axes
les m-fichiers de l'aide mémore Matlab seconde édition
Modified plotyy command to plot more than two parameters on two axes.
create graphs with 3 different Y axes and errorbars for each curve.
This simple script an extension of datetick for plotyy.
The datetick doesn't work well for plotyy due to two different axis properties. This script use for plotyy instead of datetick with one more input as% haxes = plotyy
Applications with a focus on signal procession and GUI design. Includes a plot/plotyy alternative optimized for data exploration.
utilities are listed below:plt: An alternative to the native Matlab plot and plotyy routines. A common complaint programmers have about plot (and even more so with plotyy) is that to do anything beyond the

Record speech for use as input speech signal for this and other processing exercises.

Shortcuts and menus to graphical utilities (scale, zoom, translation and initialization)


PLOTXX Create graphs with x axes on both top and bottom
PLOTXX Create graphs with x axes on both top and bottom Similar to PLOTYY, but ... the independent variable is on the y-axis, and both dependent variables are on the x-axis. For example, you may
make plots with multiple x-axes
Something like plotyy (or any of its variants), but with any number of x-axes and (perhaps) a more flexible interface.
Zoom on all x-axes of a plot
Ever used subplots and plotyy's? Using this zoom.m zooms on all x-axes of a plot. Can be toggled on and off. Default = zoom on all axes. Overwrite matlab-zoom, so you can use the zoom buttons on a

plot any number of y axis with any number of data sets, note I have included a copy of linkzoom.m

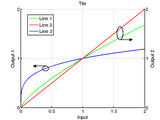
Adds a new linked axis related by ANY monotonic function. Includes ZOOM/PAN and DATETICK utility!
With PLOTYY you can add a new axis, which will be linearly related with the old one. With this function, the new axis may be related by ANY monotonic ascending or descending function with the old one

datefig: figure handle class with automatically readjusting date ticks
Version 1.1.0.0
Mark MikofskiHandle class object that automatically resets date ticks after resize, zoom or pan.
will not make sense unless the abscissa is a MATLAB serial date number.There are overloaded plot, scatter and plotyy functions that put date ticks on the x-axis. If a datefig class object if specified as

This function adds a second y-axis to a x-y plot using a relationship between the two y-axes.
This function allows to use two different y-axes with the same data in one plot. Note, that only one curve but in two different units is shown. This is the difference to plotyy which plots two
Create double axis to use with matlab plotting tools, and automatically draw markers.

Myplotyy plots different data sets with a common x-axis but using individual y-axes in one figure.

enhanced zooming, ticks, and interactive exploration of yyaxis charts


Offsets an x- or y-axis from the plotted axis area
to allow plotting of data on different scales on the same axes. These functions include plotyy in older versions, and yyaxis in newer versions. There are also numerous File Exchange entries designed

Highpass, lowpass, bandpass, and bandstop Butterworth frequency filters.
series','units','normalized') subplot(3,1,2) AX = plotyy(f1,10*log10(abs(h1)),f1,angle(h1),'semilogx'); set(get(AX(1),'ylabel'),'string','gain (dB)') set(get(AX(2),'ylabel'),'string','phase (rad)') xlim(AX(1),[min(f1

Plots each column of a matriz vs a single axis. Improvement of plotyyy.

Add multiple X or Y axes to plots, rescale data, use any function, add data tips, zoom, flexible.
This package will allow you to plot data on multiple X or Y axis. Similar to MATLAB's own plotyy function, but less limiting. Features: Create any combination of X or Y axes, plot multiple lines on

This script plots two sets of 1D data on the same figure.

Makes two shadedErrorBars on a two-sided axes
shadedErrorBaryy is a wrapper for the popular File Exchange function shadedErrorBar, It allows you to put two of these beautiful objects on two y-scales using the plotyy format. This is a bit of a

Enables you to easily plot several data with common xdata
Links the ZOOM and PAN regions of different axes.

Example Code of MultipleTimeSeries using JFreeChart within Matlab

Addsecondaxis is a simple function which adds a second abscissae or ordinate on an existing plot.
Addsecondaxis(Lim,h,axpos,vecticks)Addsecondaxis is a simple function which adds a second abscissae or ordinate on an existingplot. Unlike plotxx or plotyy it does not plot a new curve. Addsecond

Example Code of MultipleXYSeries using JFreeChart within Matlab
Indentifies subplots in figure h
spidentify: Indentifies subplots in figure h. Some figures contain axes that are superimpozed (e. g. plotyy), so that more axes objects than subplots can be present. With this function, superimpozed

Increase the number of ticks using intelligent spacing without having to manually specify them.
look bad. Equally some plotting functions such as plotyy and using subplots cause a figure to have less ticks than usual. The usual proposed solution is to set the ticks manually
GISMO - a framework for scientific research in seismology/infrasound

Creation and analysis of biochemical constraint-based models: the COBRA Toolbox v3.0

En esta practica se presenta de una forma diferente el tema de los números reales a estudiantes de ingeniería.
plotyy(numeroAtomico,puntoFusion,numeroAtomico,radioAtomico)title("Propiedades Periodicas") %Titulogrid on %Cuadriculadoxlabel("Numero Atomico")ylabel(ejes(1),"Punto de fusion, C")ylabel(ejes(2),"Radio atomico, picometros")

Fork of Plot2LaTex.m by Jan de Jong
.## Features- [x] Complex figures such as plotyy, logarithmic scales.- [x] It parses LaTeX code, even if it is not supported by Matlab LaTeX.- [x] support real transparency.- [x] SVG is a better supported

Classes for fundamental PKPD modeling in drug discovery (no support for a NLME modeling).
Select a Web Site
Choose a web site to get translated content where available and see local events and offers. Based on your location, we recommend that you select: United States.
You can also select a web site from the following list
Americas
- América Latina (Español)
- Canada (English)
- United States (English)
Europe
- Belgium (English)
- Denmark (English)
- Deutschland (Deutsch)
- España (Español)
- Finland (English)
- France (Français)
- Ireland (English)
- Italia (Italiano)
- Luxembourg (English)
- Netherlands (English)
- Norway (English)
- Österreich (Deutsch)
- Portugal (English)
- Sweden (English)
- Switzerland
- United Kingdom(English)
Asia Pacific
- Australia (English)
- India (English)
- New Zealand (English)
- 中国
- 日本Japanese (日本語)
- 한국Korean (한국어)