Chord diagrams are very common in Python and R, but there are no related functions in MATLAB before. It is not easy to draw chord diagrams of the same quality as R language, But I created a MATLAB tool that could almost do it.
↓ ↓ ↓ ↓ ↓ ↓ ↓ ↓ ↓ ↓
↑ ↑ ↑ ↑ ↑ ↑ ↑ ↑ ↑ ↑
Here is the help document:
1 Data Format
The data requirement is a numerical matrix with all values greater than or equal to 0, or a table array, or a numerical matrix and cell array for names. First, give an example of a numerical matrix:
1.1 Numerical Matrix
dataMat=randi([0,5],[5,4]);
% 绘图(draw)
CC=chordChart(dataMat);
CC=CC.draw();
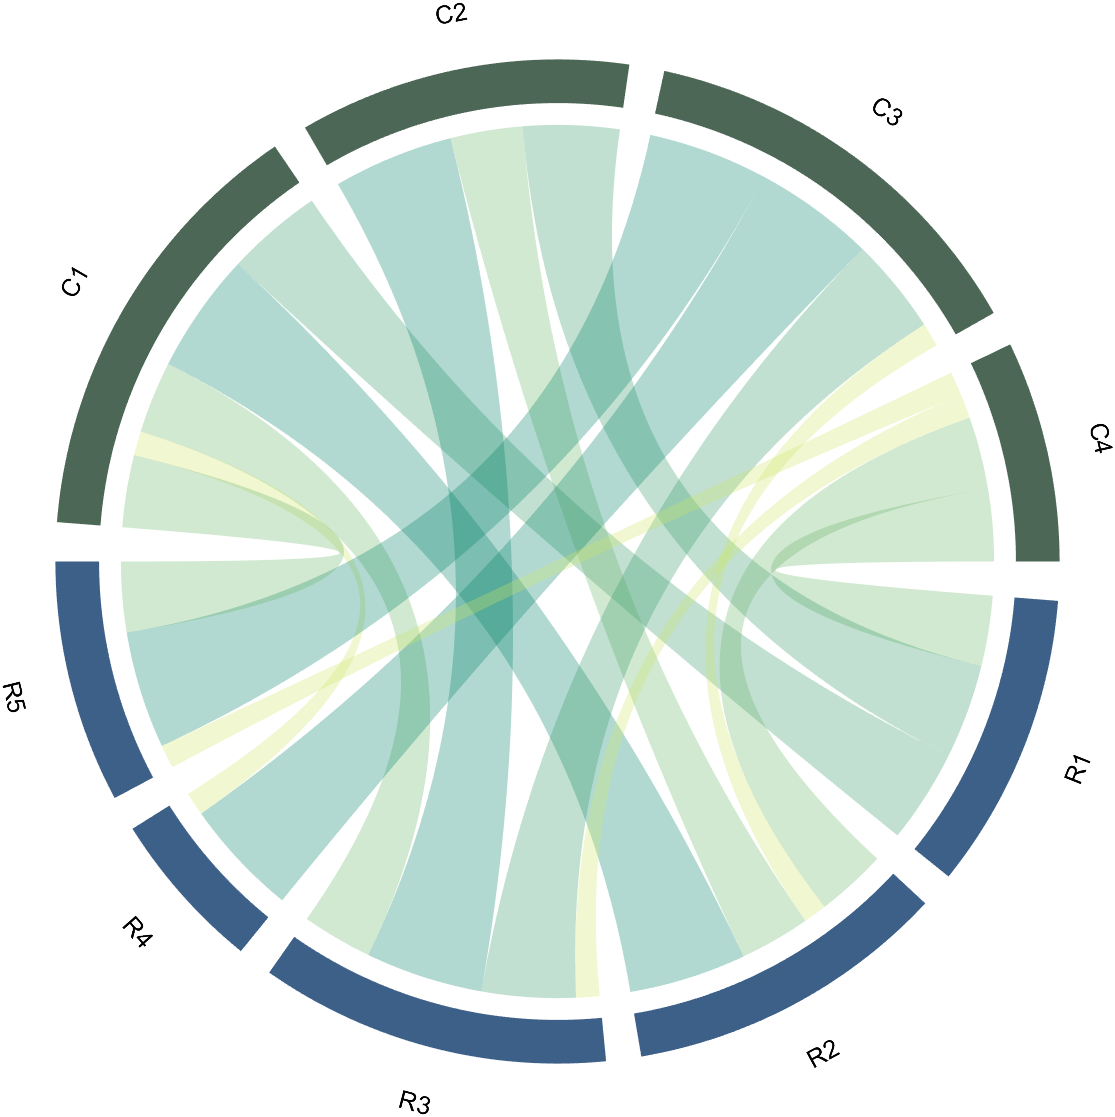
Since each object is not named, it will be automatically named Rn and Cn
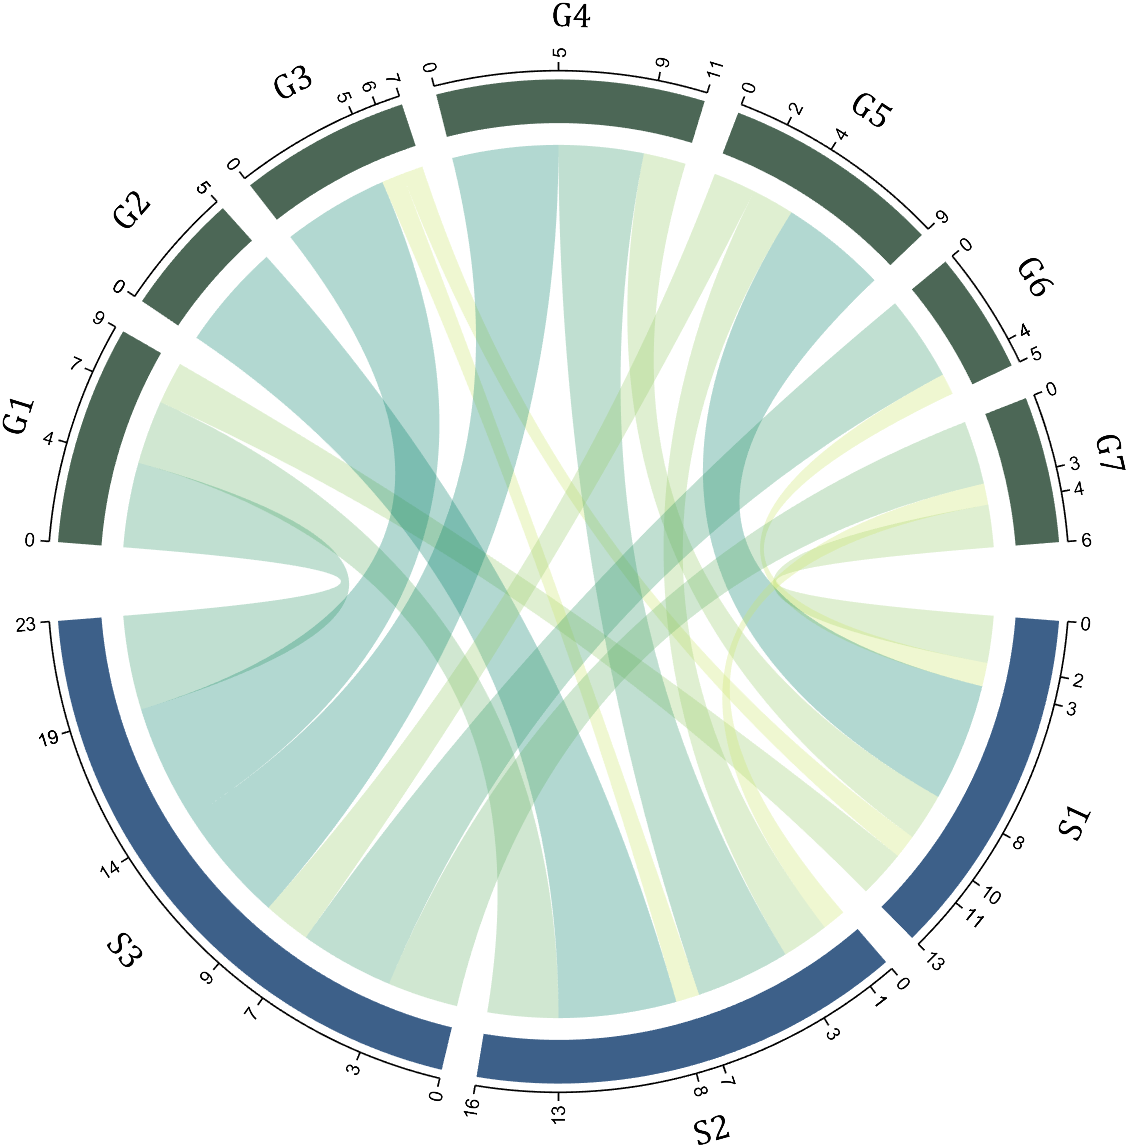
1.2 Numerical Matrix and Cell Array for Names
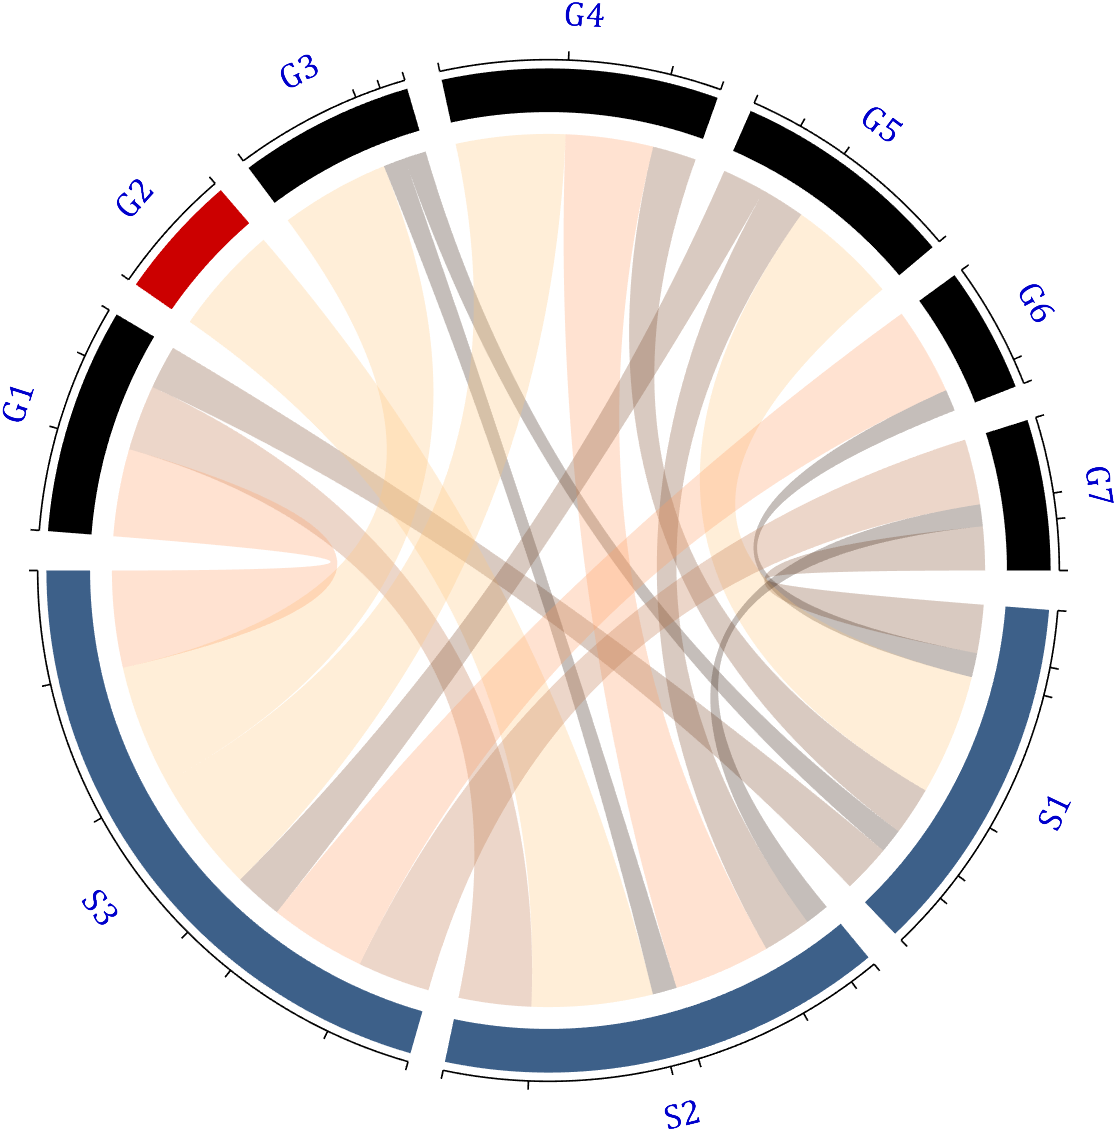
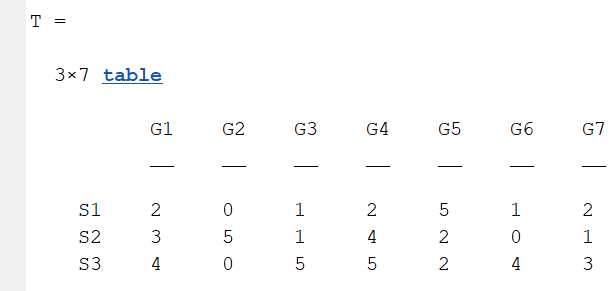
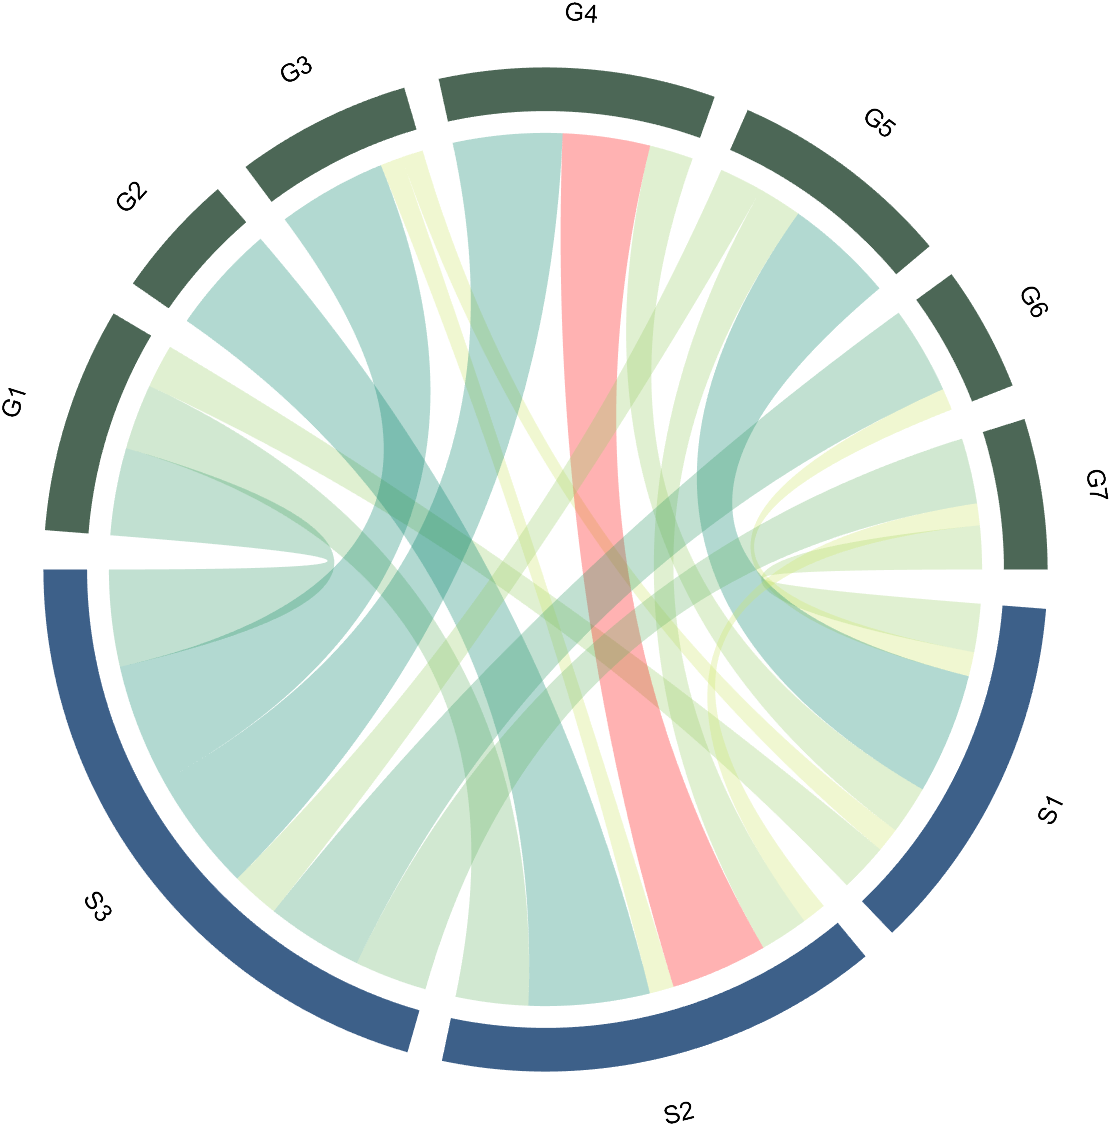
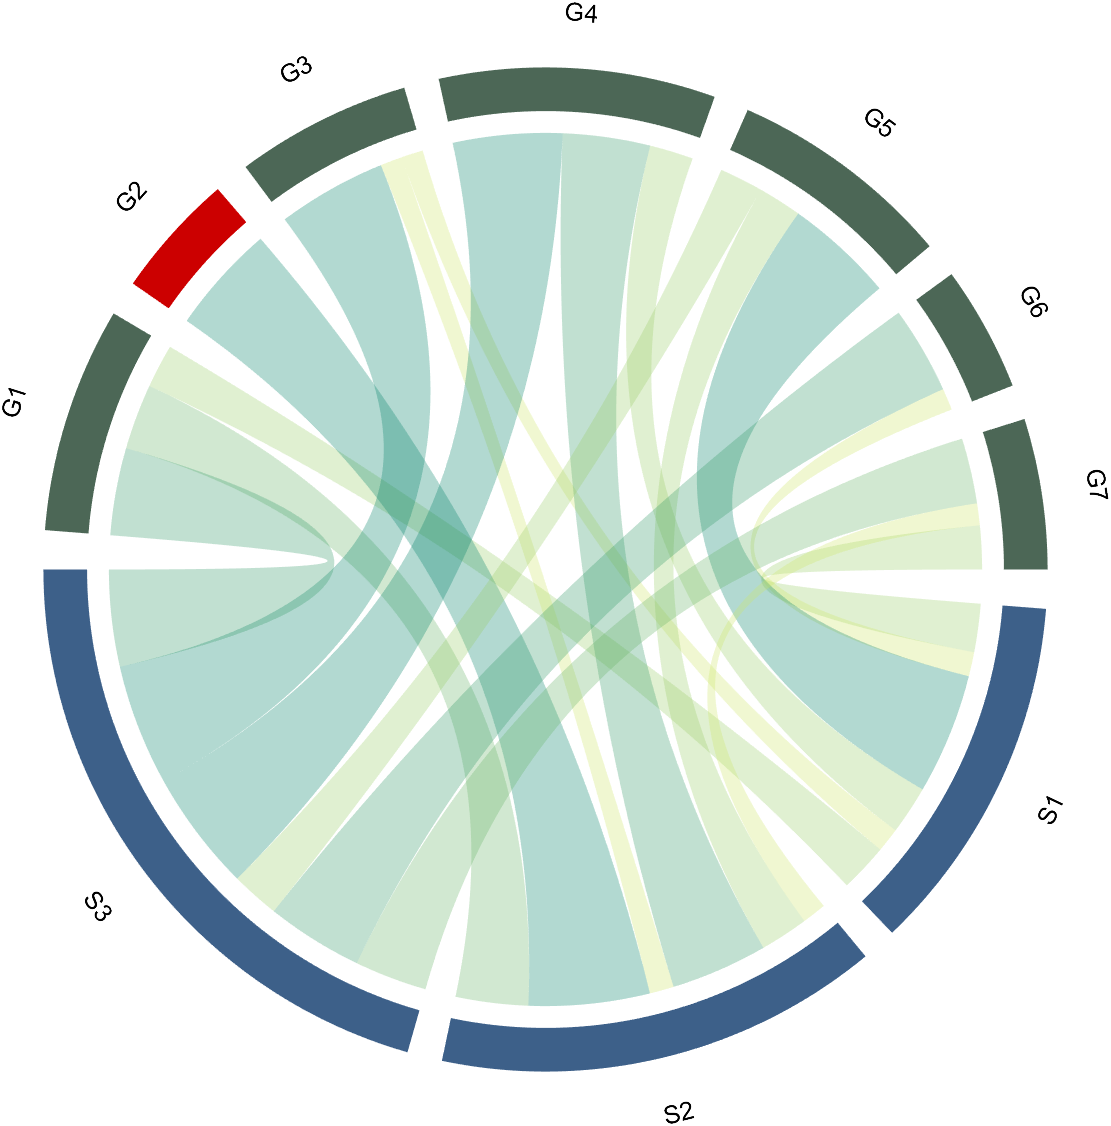
dataMat=[2 0 1 2 5 1 2;
3 5 1 4 2 0 1;
4 0 5 5 2 4 3];
colName={'G1','G2','G3','G4','G5','G6','G7'};
rowName={'S1','S2','S3'};
CC=chordChart(dataMat,'rowName',rowName,'colName',colName);
CC=CC.draw();

RowName should be the same size as the rows of the matrix
ColName should be the same size as the columns of the matrix
For this example, if the value in the second row and third column is 1, it indicates that there is an energy flow from S2 to G3, and a chord with a width of 1 is needed between these two.
1.3 Table Array
A table array in the following format is required:
2 Decorate Chord
2.1 Batch modification of chords
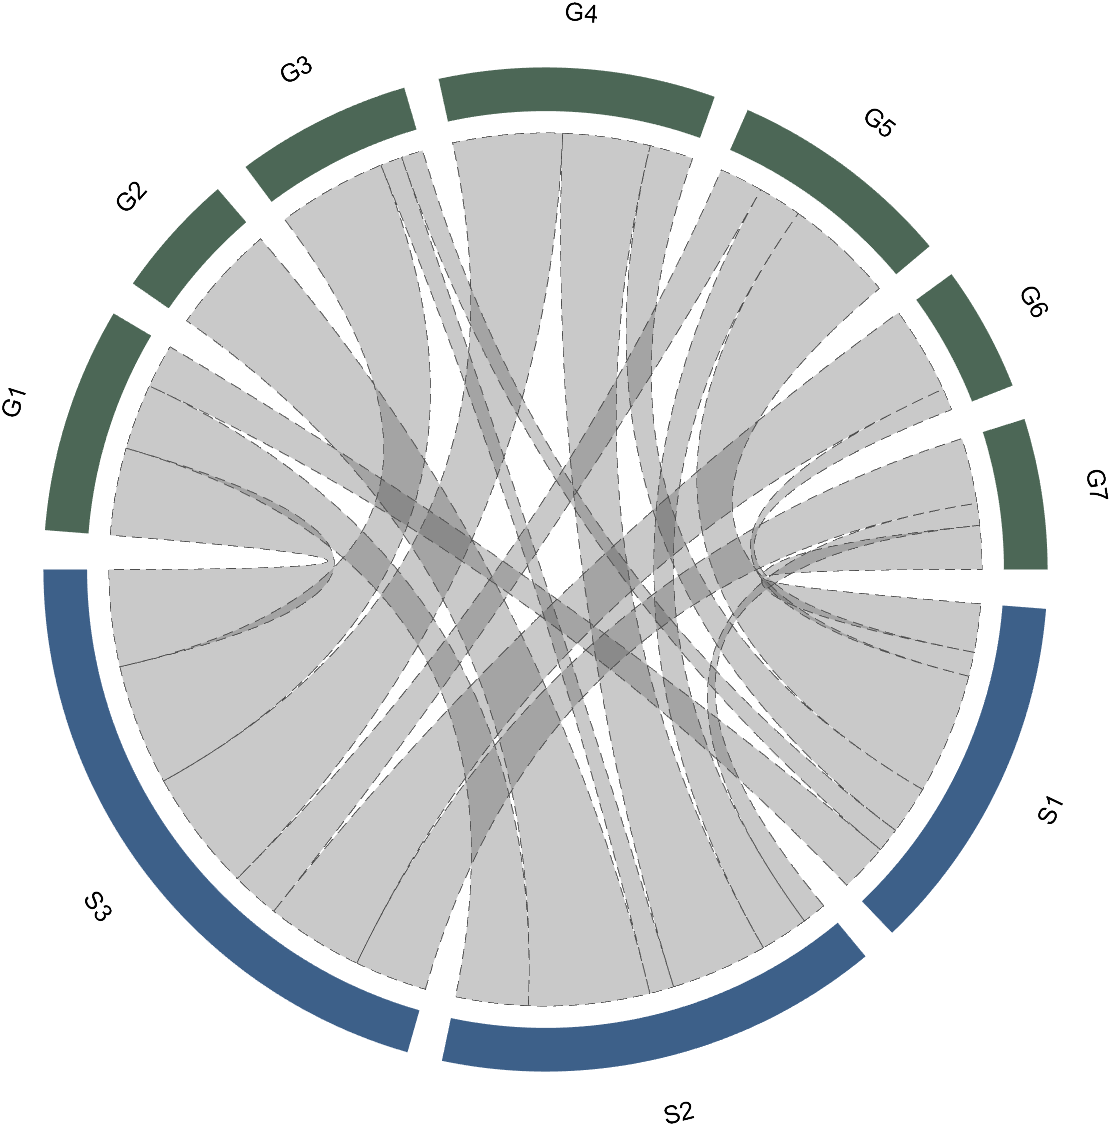
Batch modification of chords can be done using the setChordProp function, and all properties of the Patch object can be modified. For example, modifying the color of the string, edge color, edge line sstyle, etc.:
CC.setChordProp('EdgeColor',[.3,.3,.3],'LineStyle','--',...
'LineWidth',.1,'FaceColor',[.3,.3,.3])
2.2 Individual Modification of Chord
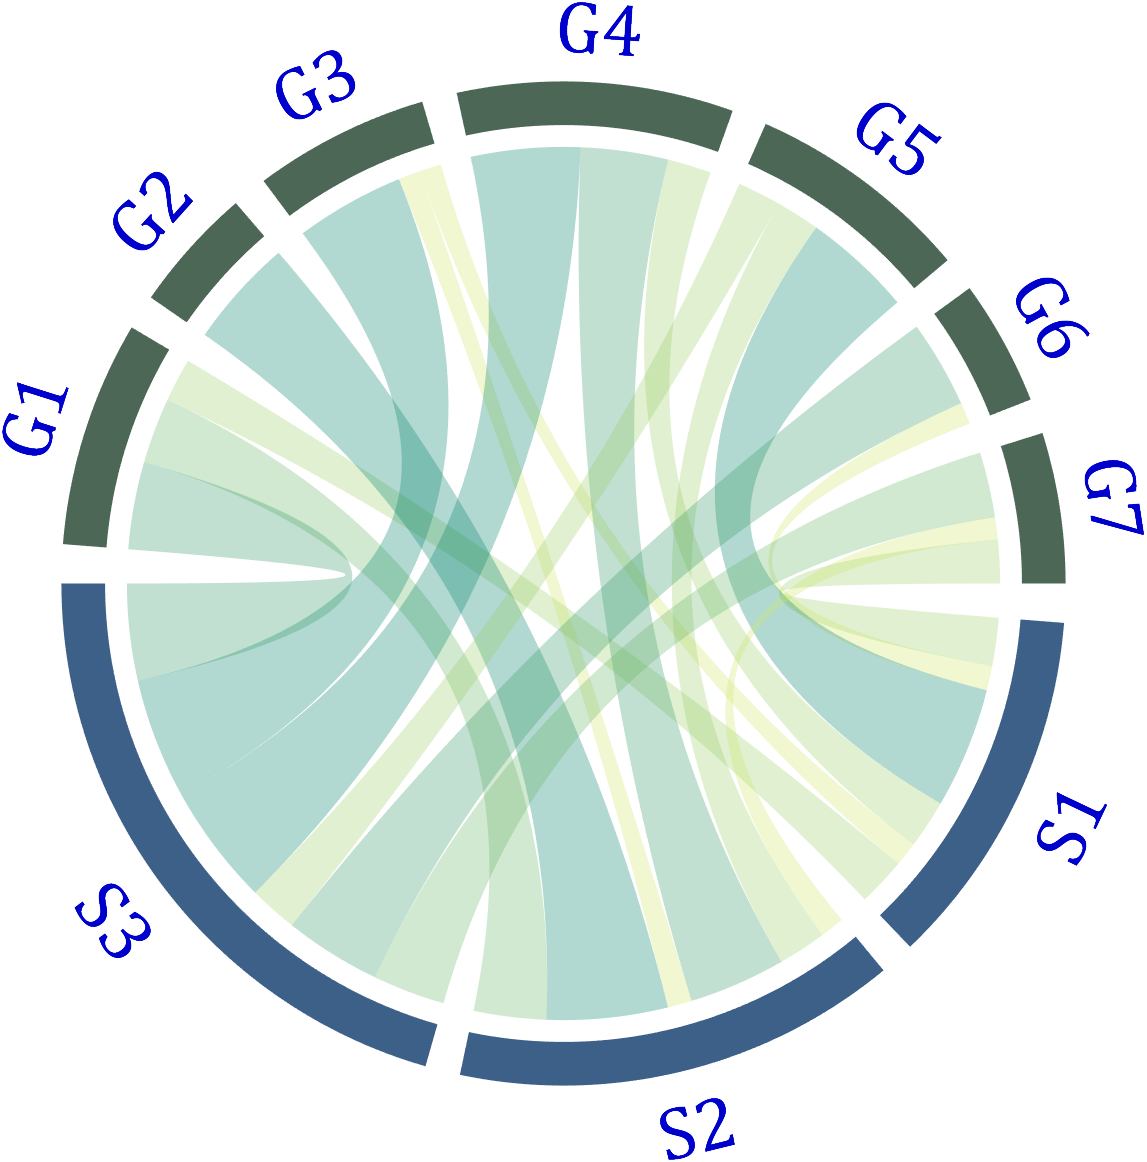
The individual modification of chord can be done using the setChordMN function, where the values of m and n correspond exactly to the rows and columns of the original numerical matrix. For example, changing the color of the strings flowing from S2 to G4 to red:
CC.setChordMN(2,4,'FaceColor',[1,0,0])
2.3 Color Mapping of Chords
Just use function colormap to do so:
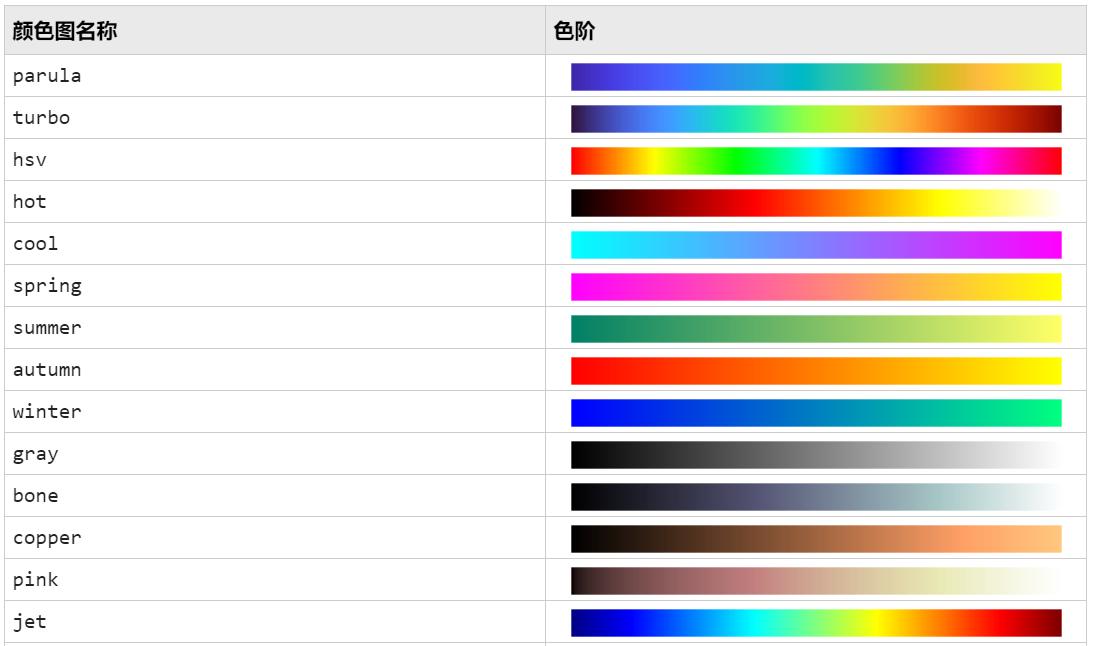
% version 1.7.0更新
% 可使用colormap函数直接修改颜色
% Colors can be adjusted directly using the function colormap(demo4)
colormap(flipud(pink))
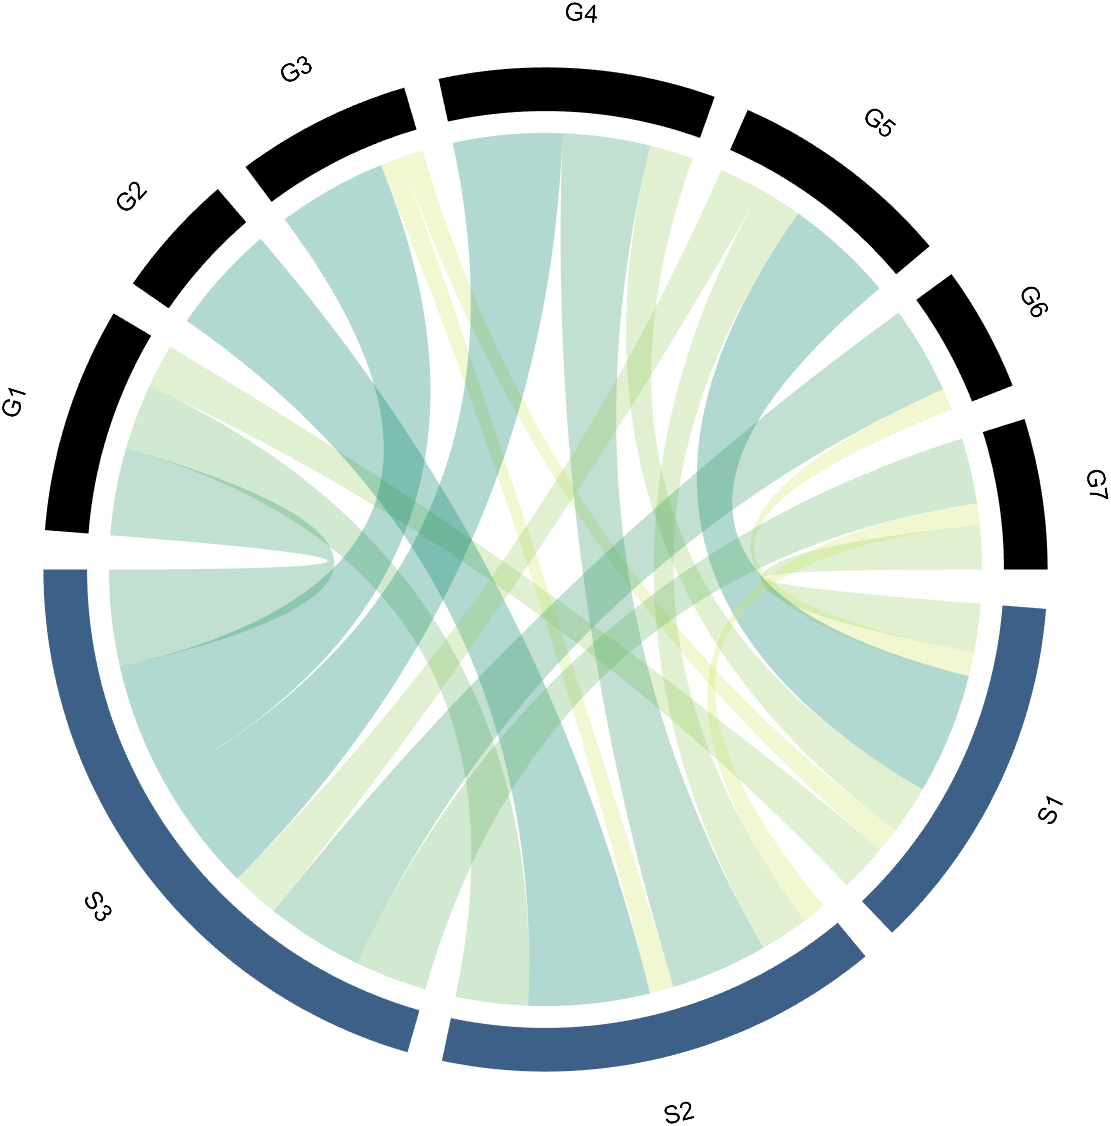
3 Arc Shaped Block Decoration
3.1 Batch Decoration of Arc-Shaped Blocks
use:
- setSquareT_Prop
- setSquareF_Prop
to modify the upper and lower blocks separately, and all attributes of the Patch object can be modified. For example, batch modify the upper blocks (change to black):
CC.setSquareT_Prop('FaceColor',[0,0,0])
3.2 Arc-Shaped Blocks Individually Decoration
use:
- setSquareT_N
- setSquareF_N
to modify the upper and lower blocks separately. For example, modify the second block above separately (changed to red):
CC.setSquareT_N(2,'FaceColor',[.8,0,0])
4 Font Adjustment
Use the setFont function to adjust the font, and all properties of the text object can be modified. For example, changing the font size, font, and color of the text:
CC.setFont('FontSize',25,'FontName','Cambria','Color',[0,0,.8])
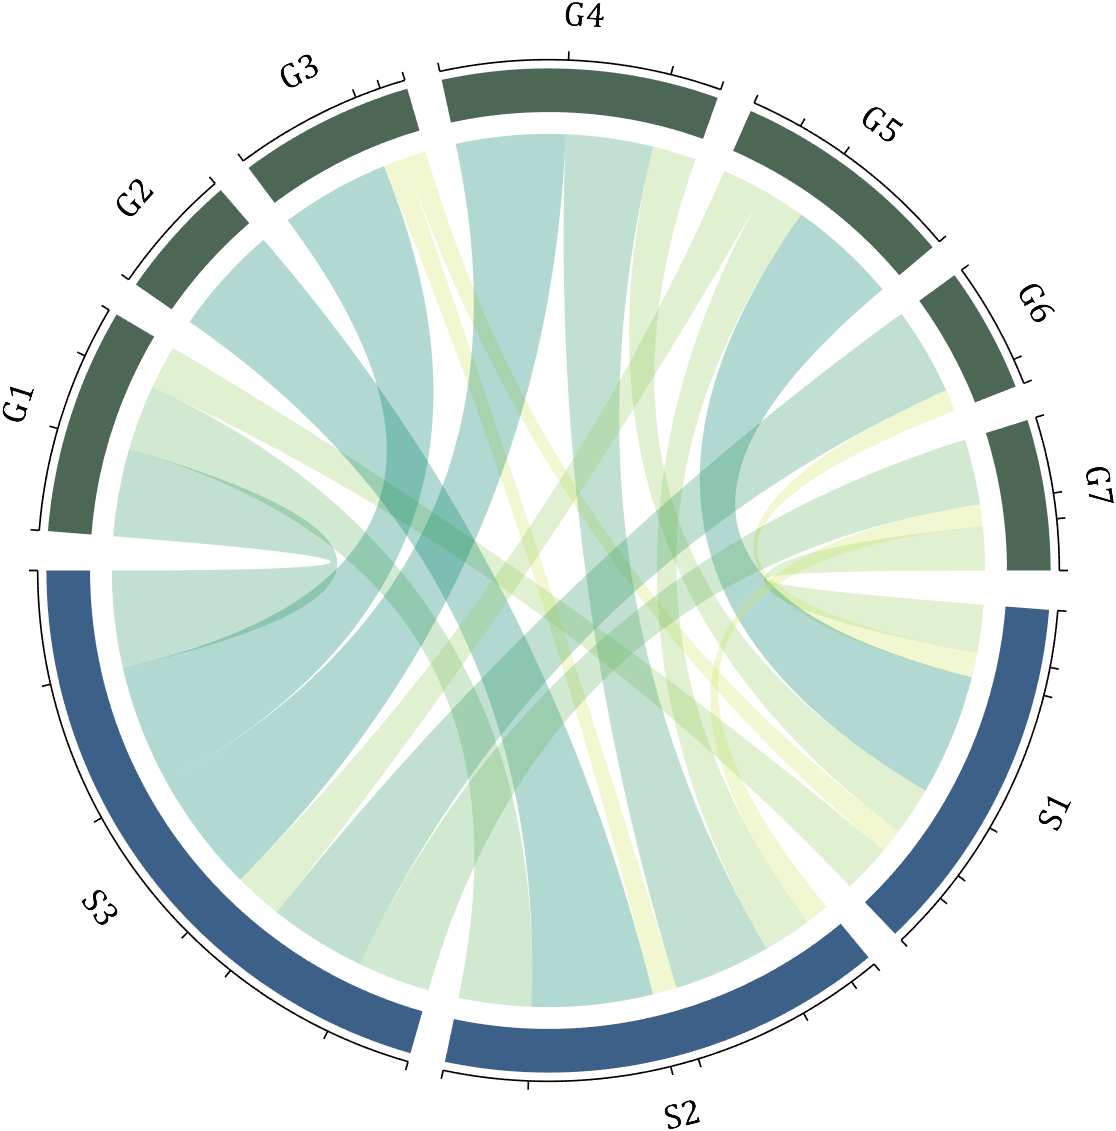
5 Show and Hide Ticks
Usage:
CC.tickState('on')
% CC.tickState('off')
6 Attribute 'Sep' with Adjustable Square Spacing
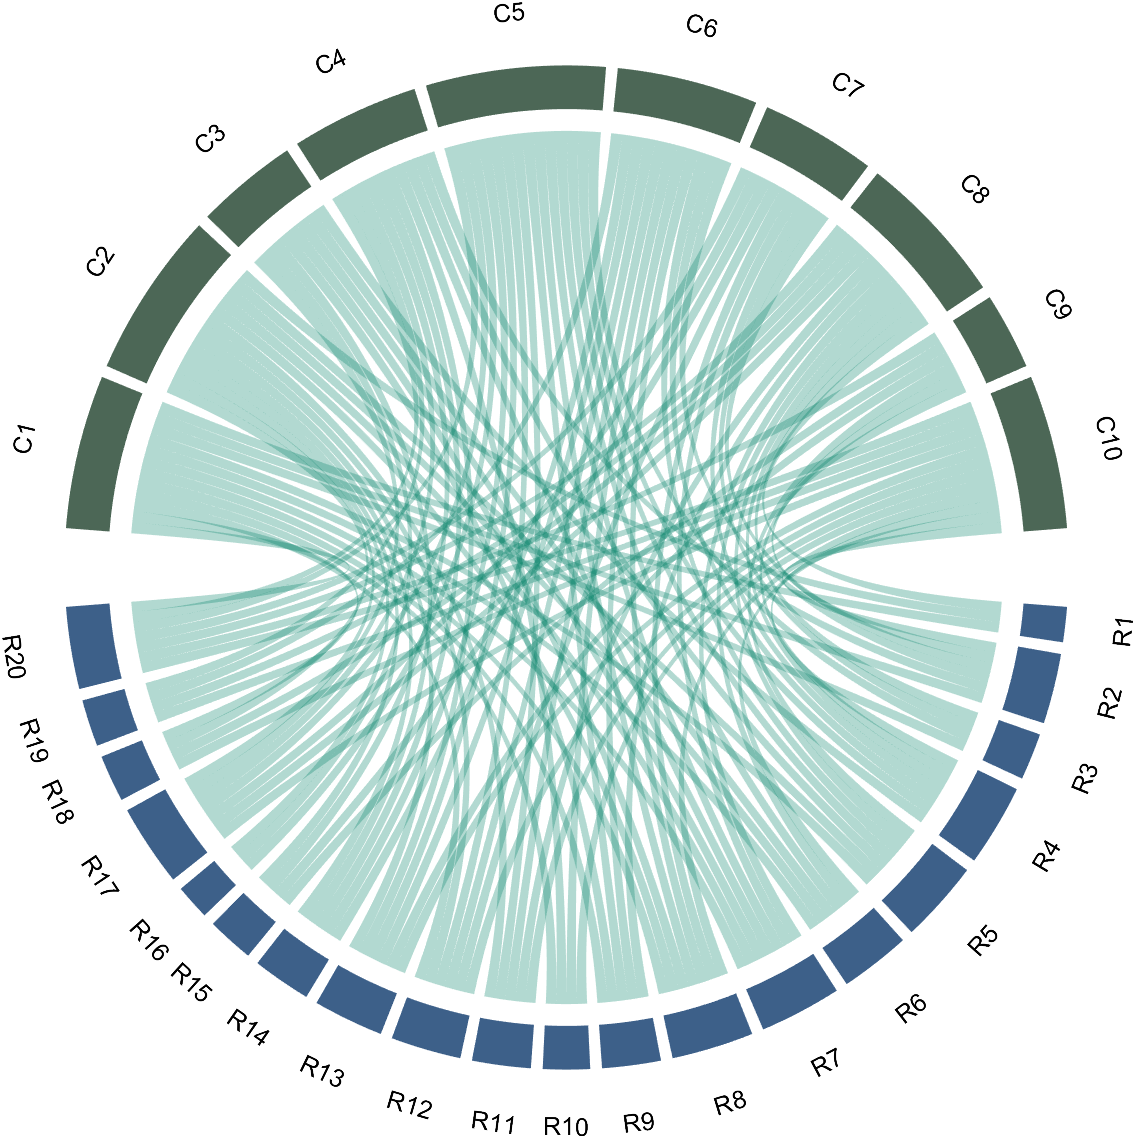
If the matrix size is large, the drawing will be out of scale:
dataMat=randi([0,1],[20,10]);
CC=chordChart(dataMat);
CC=CC.draw();
% CC.tickState('on')
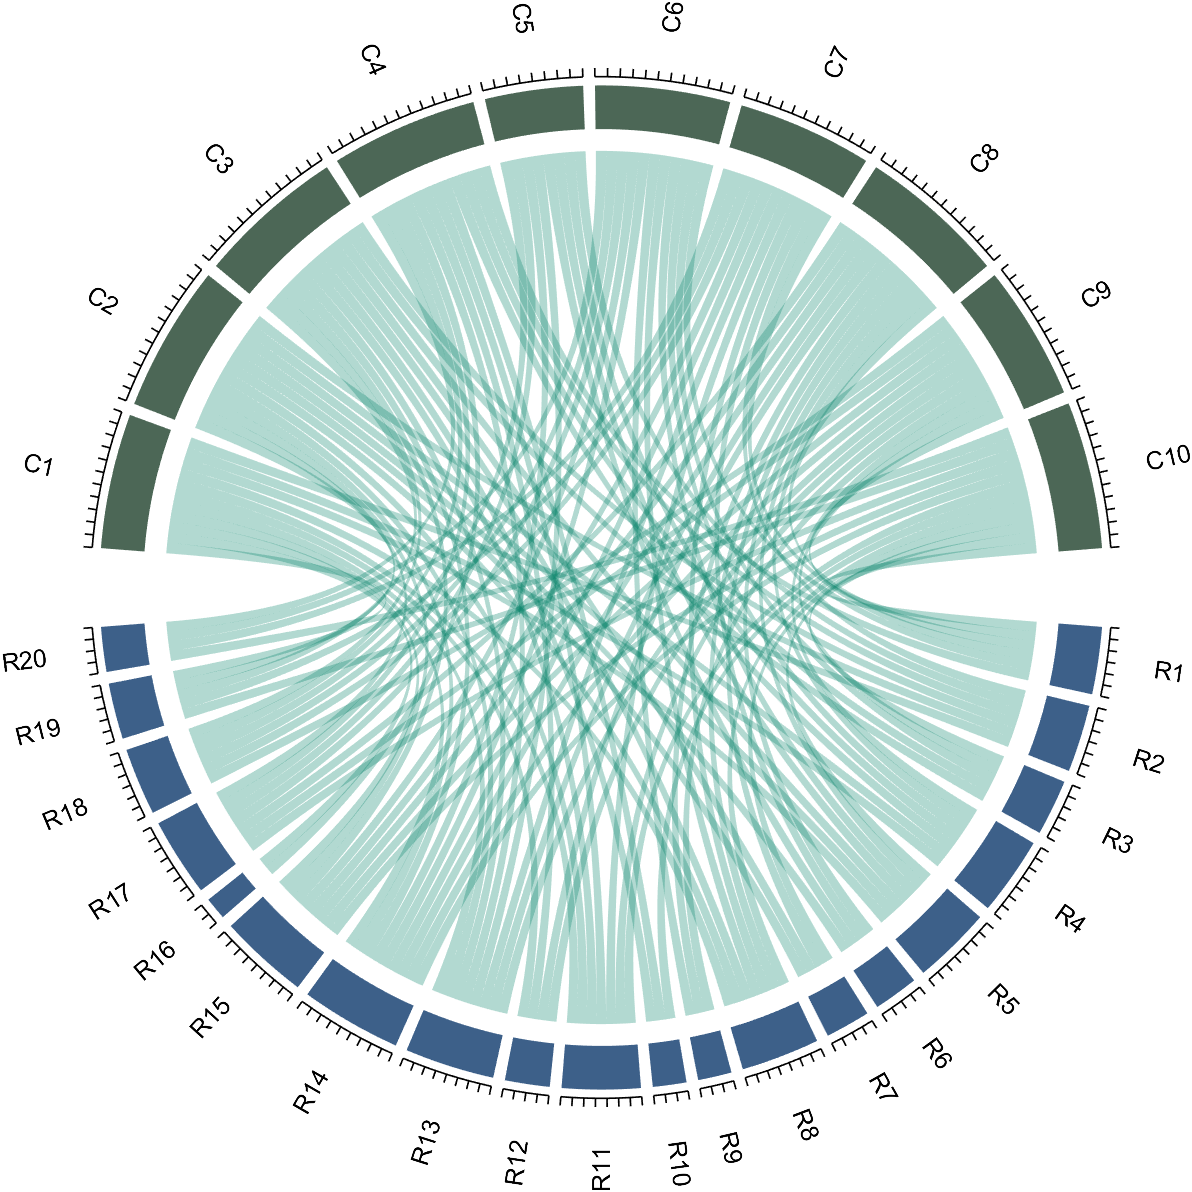
We can modify its Sep attribute:
dataMat=randi([0,1],[20,10]);
% use Sep to decrease space (separation)
% 使用 sep 减小空隙
CC=chordChart(dataMat,'Sep',1/120);
CC=CC.draw();
7 Modify Text Direction
dataMat=randi([0,1],[20,10]);
% use Sep to decrease space (separation)
% 使用 sep 减小空隙
CC=chordChart(dataMat,'Sep',1/120);
CC=CC.draw();
CC.tickState('on')
% version 1.7.0更新
% 函数labelRatato用来旋转标签
% The function labelRatato is used to rotate the label
CC.labelRotate('on')
8 Add Tick Labels
dataMat=[2 0 1 2 5 1 2;
3 5 1 4 2 0 1;
4 0 5 5 2 4 3];
colName={'G1','G2','G3','G4','G5','G6','G7'};
rowName={'S1','S2','S3'};
CC=chordChart(dataMat,'rowName',rowName,'colName',colName);
CC=CC.draw();
CC.setFont('FontSize',17,'FontName','Cambria')
% 显示刻度和数值
% Displays scales and numeric values
CC.tickState('on')
CC.tickLabelState('on')
% 调节标签半径
% Adjustable Label radius
CC.setLabelRadius(1.3);
% figure()
% dataMat=[2 0 1 2 5 1 2;
% 3 5 1 4 2 0 1;
% 4 0 5 5 2 4 3];
% dataMat=dataMat+rand(3,7);
% dataMat(dataMat<1)=0;
%
% CC=chordChart(dataMat,'rowName',rowName,'colName',colName);
% CC=CC.draw();
% CC.setFont('FontSize',17,'FontName','Cambria')
%
% % 显示刻度和数值
% % Displays scales and numeric values
% CC.tickState('on')
% CC.tickLabelState('on')
%
% % 调节标签半径
% % Adjustable Label radius
% CC.setLabelRadius(1.4);
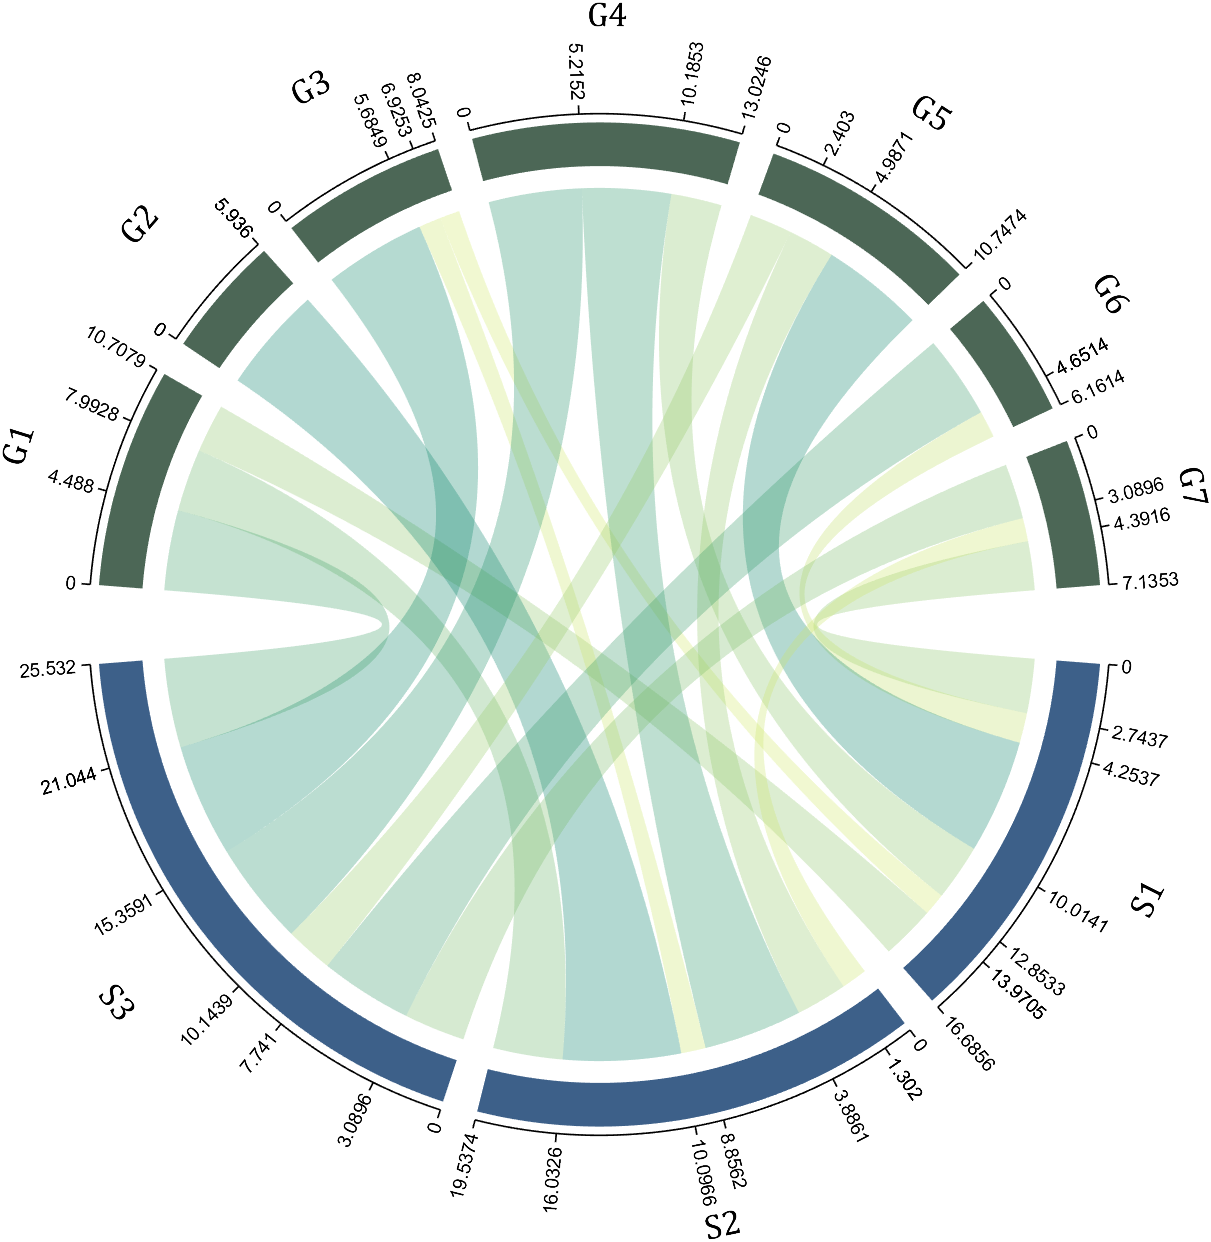
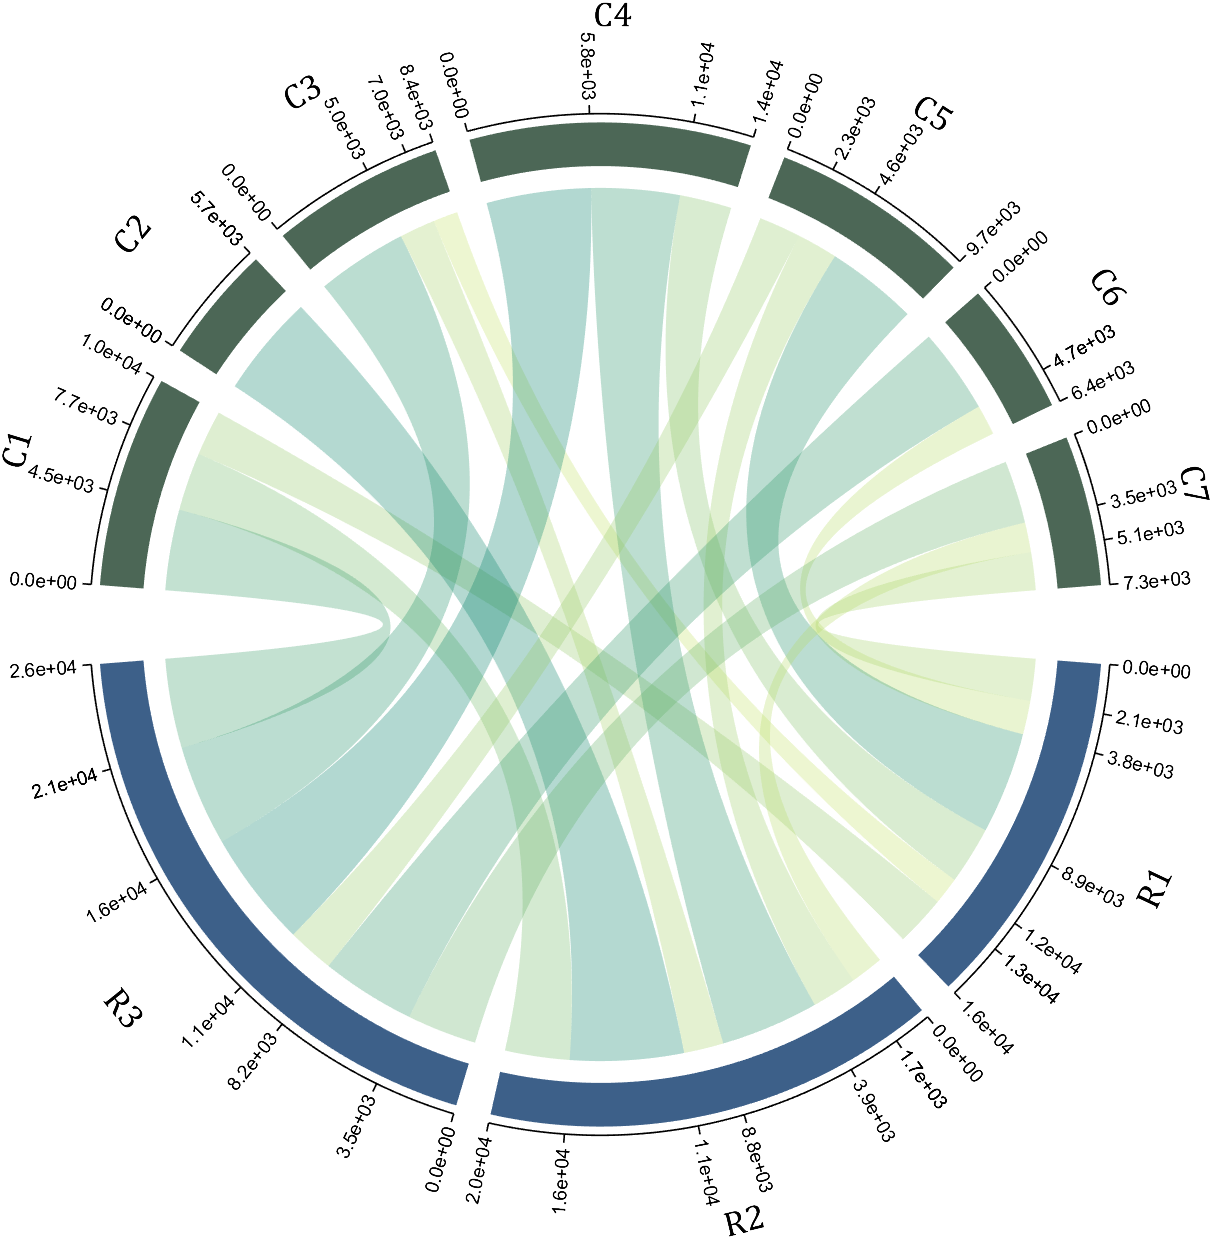
9 Custom Tick Label Format
A function handle is required to input numeric output strings. The format can be set through the setTickLabelFormat function, such as Scientific notation:
dataMat=[2 0 1 2 5 1 2;
3 5 1 4 2 0 1;
4 0 5 5 2 4 3];
dataMat=dataMat+rand(3,7);
dataMat(dataMat<1)=0;
dataMat=dataMat.*1000;
CC=chordChart(dataMat);
CC=CC.draw();
CC.setFont('FontSize',17,'FontName','Cambria')
% 显示刻度和数值
% Displays scales and numeric values
CC.tickState('on')
CC.tickLabelState('on')
% 调节标签半径
% Adjustable Label radius
CC.setLabelRadius(1.4);
% 调整数值字符串格式
% Adjust numeric string format
CC.setTickLabelFormat(@(x)sprintf('%0.1e',x))
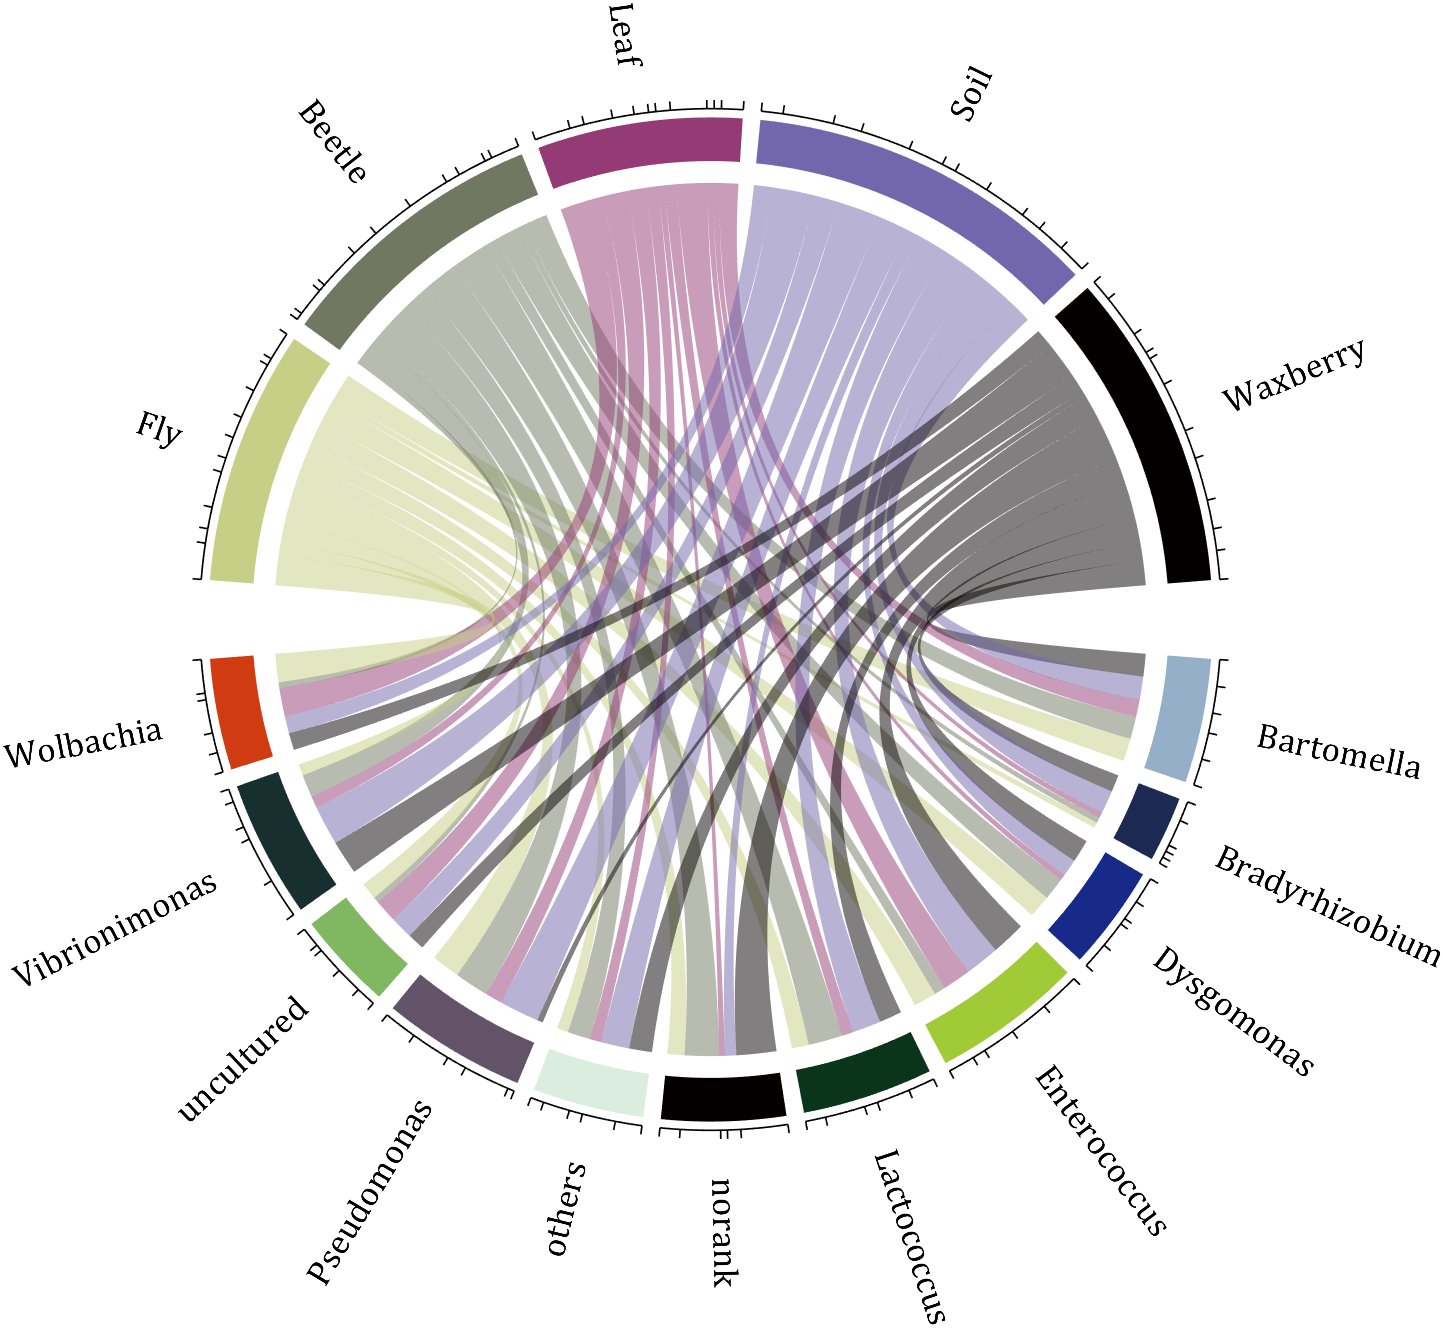
10 A Demo
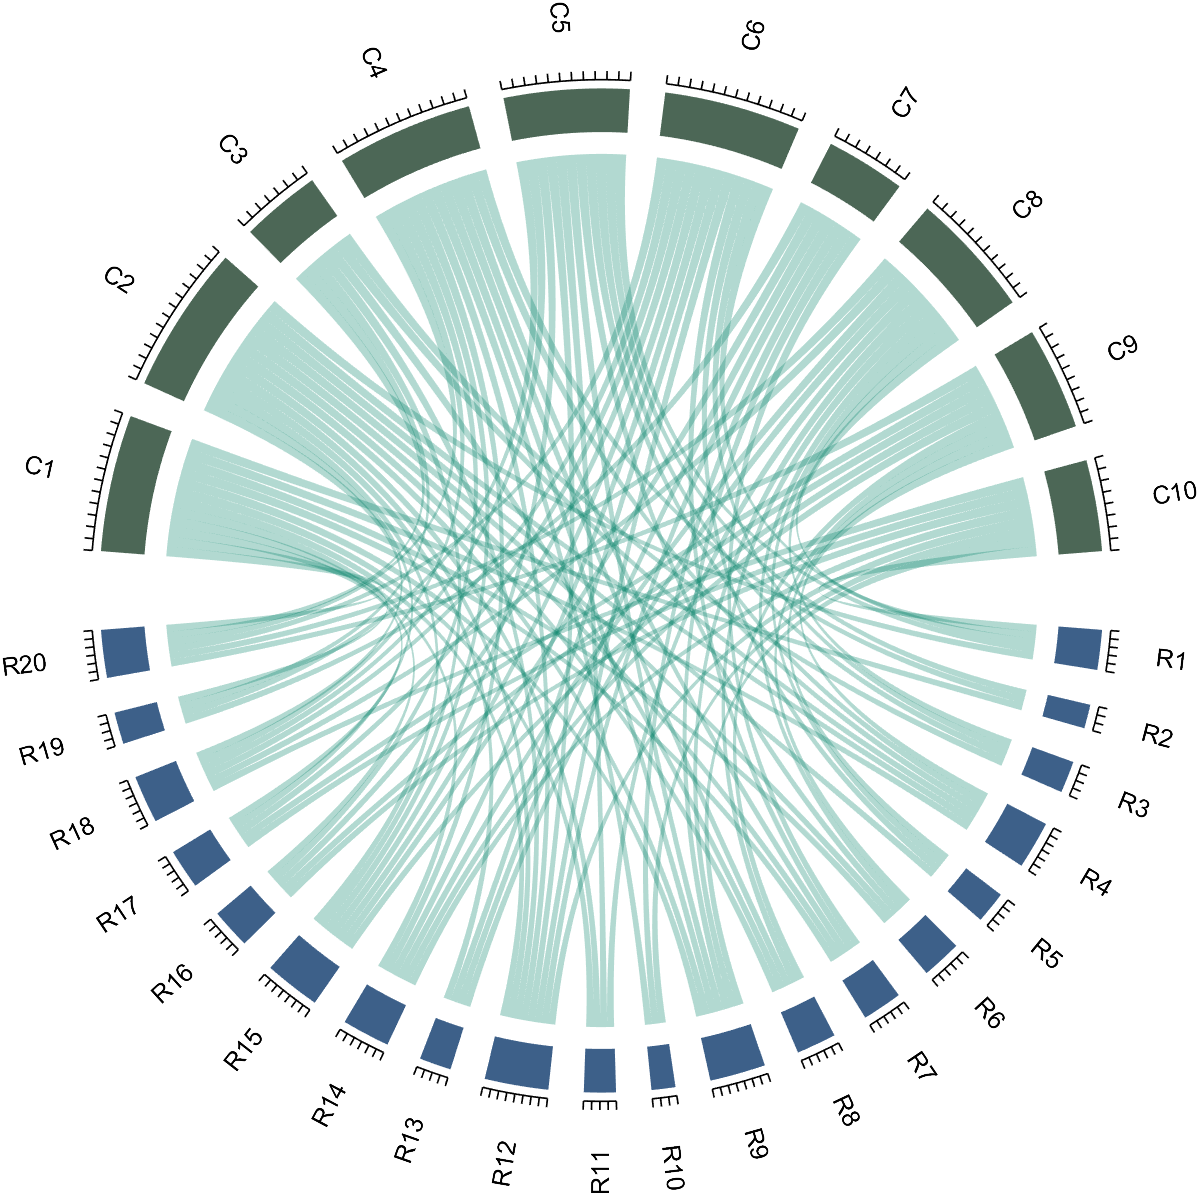
rng(2)
dataMat=randi([1,7],[11,5]);
colName={'Fly','Beetle','Leaf','Soil','Waxberry'};
rowName={'Bartomella','Bradyrhizobium','Dysgomonas','Enterococcus',...
'Lactococcus','norank','others','Pseudomonas','uncultured',...
'Vibrionimonas','Wolbachia'};
CC=chordChart(dataMat,'rowName',rowName,'colName',colName,'Sep',1/80);
CC=CC.draw();
% 修改上方方块颜色(Modify the color of the blocks above)
CListT=[0.7765 0.8118 0.5216;0.4431 0.4706 0.3843;0.5804 0.2275 0.4549;
0.4471 0.4039 0.6745;0.0157 0 0 ];
for i=1:5
CC.setSquareT_N(i,'FaceColor',CListT(i,:))
end
% 修改下方方块颜色(Modify the color of the blocks below)
CListF=[0.5843 0.6863 0.7843;0.1098 0.1647 0.3255;0.0902 0.1608 0.5373;
0.6314 0.7961 0.2118;0.0392 0.2078 0.1059;0.0157 0 0 ;
0.8549 0.9294 0.8745;0.3882 0.3255 0.4078;0.5020 0.7216 0.3843;
0.0902 0.1843 0.1804;0.8196 0.2314 0.0706];
for i=1:11
CC.setSquareF_N(i,'FaceColor',CListF(i,:))
end
% 修改弦颜色(Modify chord color)
for i=1:5
for j=1:11
CC.setChordMN(j,i,'FaceColor',CListT(i,:),'FaceAlpha',.5)
end
end
CC.tickState('on')
CC.labelRotate('on')
CC.setFont('FontSize',17,'FontName','Cambria')
Hope to have your Reviews and Stars!!!
↓ ↓ ↓ ↓ ↓ ↓ ↓ ↓ ↓ ↓
↑ ↑ ↑ ↑ ↑ ↑ ↑ ↑ ↑ ↑
4 Comments
It would be very nice to have an interactive version by clicking nodes and edges for highlighting
Great idea! Can you try this link to MATLAB Online: https://matlab.mathworks.com/open/fileexchange/v1?id=116550&file=chordChart/demo1.m
This is a new feature where anyone can open a File Exchange entry directly into MATLAB Online.
Hi Hans,
I am able to open the link and run the demo1.m script.
Unfortunately clicking a node or edge just returns the position in the datatip.
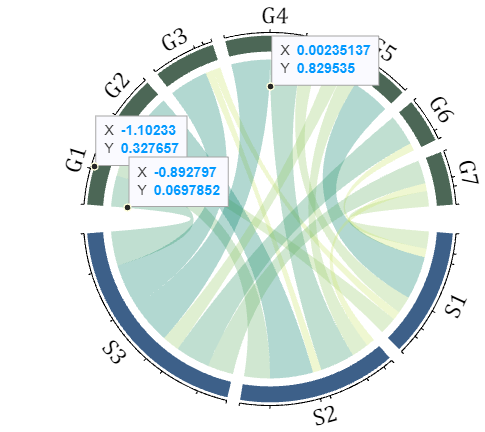
--Han
Great documentation! I took a look at the File Exchange page. There's a question from someone about what the parts mean.
See Also
Tags
You can also select a web site from the following list
Americas
- América Latina (Español)
- Canada (English)
- United States (English)
Europe
- Belgium (English)
- Denmark (English)
- Deutschland (Deutsch)
- España (Español)
- Finland (English)
- France (Français)
- Ireland (English)
- Italia (Italiano)
- Luxembourg (English)
- Netherlands (English)
- Norway (English)
- Österreich (Deutsch)
- Portugal (English)
- Sweden (English)
- Switzerland
- United Kingdom (English)
Asia Pacific
- Australia (English)
- India (English)
- New Zealand (English)
- 中国
- 日本Japanese (日本語)
- 한국Korean (한국어)